
MIT has launched a new website in beta form, making available a broad swath of detailed information about energy use and carbon emissions on campus. This rich resource is available to the Institute’s students, faculty, and staff, for education, research, and decision-making purposes.
The rollout of this central data “dashboard,” called Energize_MIT, is the latest in a series of steps implementing the goals and commitments set out in MIT’s 2015 Plan for Action on Climate Change. The site offers a single web-based entry point to a centralized pool of data, which will improve collaboration across operational and departmental groups.
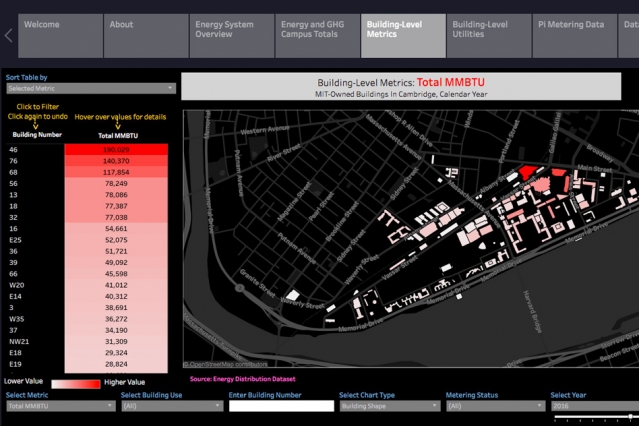
The site provides two kinds of information. First, a set of interactive graphic visualizations depicts information such as campus-wide and building-by-building details about use of electricity, natural gas, fuel oil, steam, and chilled water, as well as the greenhouse gas emissions associated with energy use. And second, datasets can be downloaded and used to drill down into details of energy use, including some as fine-grained as energy-use measurements in 15-minute increments.
“Energize_MIT is an invaluable tool not just for helping us to better understand and manage campus energy use, but also for engaging the MIT community in finding ways to reduce our energy consumption and greenhouse gas emissions,” says Maria T. Zuber, MIT’s vice president for research. “This is an important part of MIT’s climate action plan. I am grateful to the members of the Energize_MIT team for their hard work in bringing this platform online.”
The data displayed through this system can be valuable for a wide variety of research projects but should also be useful in the day-to-day operations of the campus, Wietsma says. For example, the dashboard can help to identify buildings with the largest total and per-square-foot energy usage, and to examine energy trends over time as the Institute moves toward its carbon reduction goal.
Already, some faculty members are starting to use this data, for example to help test new ways of analyzing and modeling buildings’ energy use. This work represents one answer to the climate action plan’s call for ways to use the MIT campus as a “living laboratory” for energy and climate research.
“The new data hub is an excellent initiative,” says associate professor of architecture Christoph Reinhart, “that will empower groups from across MIT to better understand how our campus operates and to propose a plethora of interventions to make our lives more comfortable and productive as well as to enhance our buildings’ resource efficiency.”
Reinhart says he and his students are using the platform to develop and test their building energy models, as a way of helping owners of existing buildings to decide which kinds of changes and upgrades will produce the most effective reductions in carbon emissions.
The new data hub “is a great tool to explore building energy data,” says Mark Mullins, senior energy efficiency engineer with the MIT Department of Facilities. “It allows me to understand building performance at the monthly, daily, and hourly level. I can compare performance of different buildings to help me identify ways to save energy, and evaluate performance over time after energy efficiency measures are installed.”
The site is intended as the first step of a much broader package of information and resources regarding MIT’s sustainability — including information on transportation, water, waste, and other kinds of data — that is to be launched later this year.