The Centers for Disease Control released its weekly FluView report for the week ending January 20:
“Influenza activity increased again according to the latest FluView report. All U.S. states but Hawaii continue to report widespread flu activity and the number of states experiencing high influenza activity increased from 32 states plus New York City and Puerto Rico to 39 states plus New York City and Puerto Rico. Indicators used to track influenza-like illness (ILI) activity are now higher than what was seen during the peak of the 2014-2015 season. The overall hospitalization rate is now similar to the overall hospitalization rate reported during the same week of the 2014-2015 season. CDC also is reporting an additional 7 flu-related pediatric deaths, bringing the total number of flu-related pediatric deaths reported this season to 37 so far. Flu activity is likely to continue for several more weeks.’
“CDC continues to recommend influenza vaccination for all persons 6 months of age and older as flu viruses are likely to continue circulating for weeks. In addition, in the context of widespread influenza activity, CDC is reminding clinicians and the public about the importance of antiviral medications for treatment of influenza in people who are severely ill and people who are at high risk of serious flu complications. Below is a summary of the key flu indicators for the week ending January 20, 2018 (week 3):
- Influenza-like Illness Surveillance: For the week ending January 20, the proportion of people seeing their health care provider for influenza-like illness (ILI) was 6.6%, which is above the national baseline of 2.2% and is the highest ILI percentage recorded since the 2009 pandemic. All 10 regions reported a proportion of outpatient visits for ILI at or above their region-specific baseline levels. ILI has been at or above the national baseline for eight weeks so far this season. Over the past five seasons, ILI has remained at or above baseline for 16 weeks on average.
- Additional ILINet data, including national, regional, and select state-level data for the current and previous seasons, can be found at http://gis.cdc.gov/grasp/fluview/fluportaldashboard.html.
- Influenza-like Illness State Activity Indicator Map: New York City, Puerto Rico, and 39 states experienced high ILI activity (Alabama, Arizona, Arkansas, California, Florida, Georgia, Illinois, Indiana, Iowa, Kansas, Kentucky, Louisiana, Maryland, Massachusetts, Michigan, Minnesota, Mississippi, Missouri, Nebraska, Nevada, New Hampshire, New Jersey, New Mexico, New York, North Carolina, Ohio, Oklahoma, Oregon, Pennsylvania, Rhode Island, South Carolina, South Dakota, Tennessee, Texas, Virginia, Washington, West Virginia, Wisconsin, and Wyoming). The District of Columbia and five states (Colorado, Connecticut, Hawaii, Idaho, and Vermont) experienced moderate ILI activity. Three states experienced low ILI activity (Alaska, North Dakota and Utah). Three states experienced minimal ILI activity (Delaware, Maine, and Montana).
- Additional data, including data for previous seasons, can be found at https://gis.cdc.gov/grasp/fluview/main.html
- Geographic Spread of Influenza Viruses: Widespread influenza activity was reported by Puerto Rico and 49 states (Alabama, Alaska, Arizona, Arkansas, California, Colorado, Connecticut, Delaware, Florida, Georgia, Idaho, Illinois, Indiana, Iowa, Kansas, Kentucky, Louisiana, Maine, Maryland, Massachusetts, Michigan, Minnesota, Mississippi, Missouri, Montana, Nebraska, Nevada, New Hampshire, New Jersey, New Mexico, New York, North Carolina, North Dakota, Ohio, Oklahoma, Oregon, Pennsylvania, Rhode Island, South Carolina, South Dakota, Tennessee, Texas, Utah, Vermont, Virginia, Washington, West Virginia, Wisconsin, and Wyoming). Regional influenza activity was reported by Guam. Local influenza activity was reported by the District of Columbia and one state (Hawaii). Sporadic activity was reported by the U.S. Virgin Islands. Geographic spread data show how many areas within a state or territory are seeing flu activity.
- Additional data are available at: https://gis.cdc.gov/grasp/fluview/FluView8.html.
- Flu-Associated Hospitalizations: Since October 1, 2017, 11,965 laboratory-confirmed influenza-associated hospitalizations have been reported through the Influenza Hospitalization Network (FluSurv-NET), a population-based surveillance network for laboratory-confirmed influenza-associated hospitalizations. This translates to a cumulative overall rate of 41.9 hospitalizations per 100,000 people in the United States.
- The highest hospitalization rate is among people 65 years and older (1 per 100,000), followed by adults aged 50-64 years (44.2 per 100,000), and younger children aged 0-4 years (27.0 per 100,000). During most seasons, adults 65 years and older have the highest hospitalization rates, followed by children 0-4 years.
- During 2014-2015, hospitalization rates reported during week 3 for all ages were 40.5 per 100,000. During that same week, hospitalization rates for people 65 years and older were 198.4 per 100,000. Hospitalization rates for younger children 0-4 years were 38.2 per 100,000.
- Additional data, including hospitalization rates during other influenza seasons, can be found at http://gis.cdc.gov/GRASP/Fluview/FluHospRates.html and http://gis.cdc.gov/grasp/fluview/FluHospChars.html.
- Mortality Surveillance:
- The proportion of deaths attributed to pneumonia and influenza (P&I) increased sharply to 9.1% for the week ending January 6, 2018 (week 1). This percentage is above the epidemic threshold of 7.2% for week 3 in the National Center for Health Statistics (NCHS) Mortality Surveillance System.
- Region and state-specific data are available at https://gis.cdc.gov/grasp/fluview/mortality.html.
- Pediatric Deaths:
- Seven influenza-associated pediatric deaths were reported to CDC during week 3.
- One death was associated with an influenza A(H3) virus and occurred during week 2 (the week ending January 13, 2018). Two deaths were associated with an influenza A(H1N1)pdm09 virus and occurred during weeks 1 and 3 (the weeks ending January 6, 2018, and January 20, 2018, respectively). Three deaths were associated with an influenza A virus for which no subtyping was performed and occurred during weeks 52 and 1 (the weeks ending December 30, 2017, and January 6, 2018, respectively). One death was associated with an influenza B virus and occurred during week 2.
- A total of 37 influenza-associated pediatric deaths for the 2017-2018 season have been reported to CDC.
- Additional information on pediatric deaths is available on FluView Interactive at: https://gis.cdc.gov/GRASP/Fluview/PedFluDeath.html.
- Seven influenza-associated pediatric deaths were reported to CDC during week 3.
- Laboratory Data:
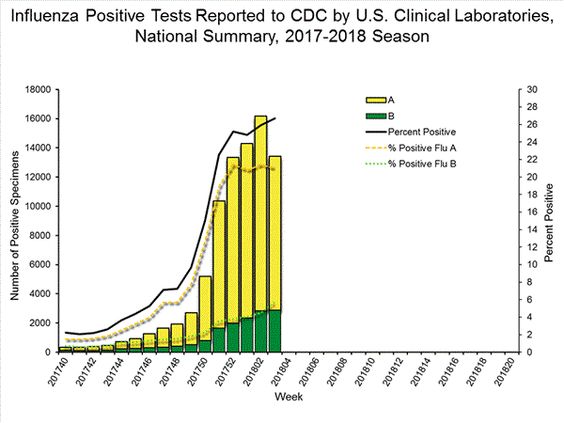
- Nationally, the percentage of respiratory specimens testing positive for influenza viruses in clinical laboratories during the week ending January 20 was 26.7%.
- Regionally, the three week average percent of specimens testing positive for influenza in clinical laboratories ranged from 20.2% to 30.5%.
- During the week ending January 20, of the 13,421 (26.7%) influenza-positive tests reported to CDC by clinical laboratories, 10,536 (78.5%) were influenza A viruses and 2,885 (21.5%) were influenza B viruses.
- The most frequently identified influenza virus subtype reported by public health laboratories was influenza A(H3N2) virus.
- During the week ending January 20, 1,136 (84.2%) of the 1,349 influenza-positive tests reported to CDC by public health laboratories were influenza A viruses and 213 (15.8%) were influenza B viruses. Of the 1,058 influenza A viruses that were subtyped, 914 (86.4%) were H3N2 viruses and 144 (13.6%) were (H1N1)pdm09 viruses.
- The majority of the influenza viruses collected from the United States during October 1, 2017 through January 20, 2018 were characterized antigenically and genetically as being similar to the cell-grown reference viruses representing the 2017–18 Northern Hemisphere influenza vaccine viruses.
- Since October 1, 2017, CDC has tested 181 influenza A(H1N1)pdm09, 645 influenza A(H3N2), and 229 influenza B viruses for resistance to antiviral medications (i.e. oseltamivir, zanamivir, or peramivir). While the majority of the tested viruses showed susceptibility to the antiviral drugs, two (1.1%) H1N1pdm09 viruses were resistant to both oseltamivir and peramivir, but was sensitive to zanamivir.’
“FluView is available – and past issues are archived – on the CDC website.’
“Note: Delays in reporting may mean that data changes over time. The most up to date data for all weeks during the 2017-2018 season can be found on the current FluView and FluView Interactive.”